Exploring the Dashboard
Edit on GitHubThis page is intended for all users to use the centralized Dashboard to monitor the status of digital accessibility.
We designed it to help you identify and track blockers across your experiences. Think of this page as a "health check" for your site's inclusivity. Below are the key sections you'll need to navigate.
Key areas of the interface
- Audit Title: View the specific project monitored, at the top of the page.
- Audit name: Descriptive title of your audit.
- Edit: Use the pencil icon to edit the name of your audit.
- Delete: The trash can icon lets you delete your entire audit.
- “Scan Now”: for a Manual Scan. If you’ve just made fixes, you can click Scan Now to refresh the data immediately.
- Share: Copy a link to this report to share.

Performance Chart and Snapshot
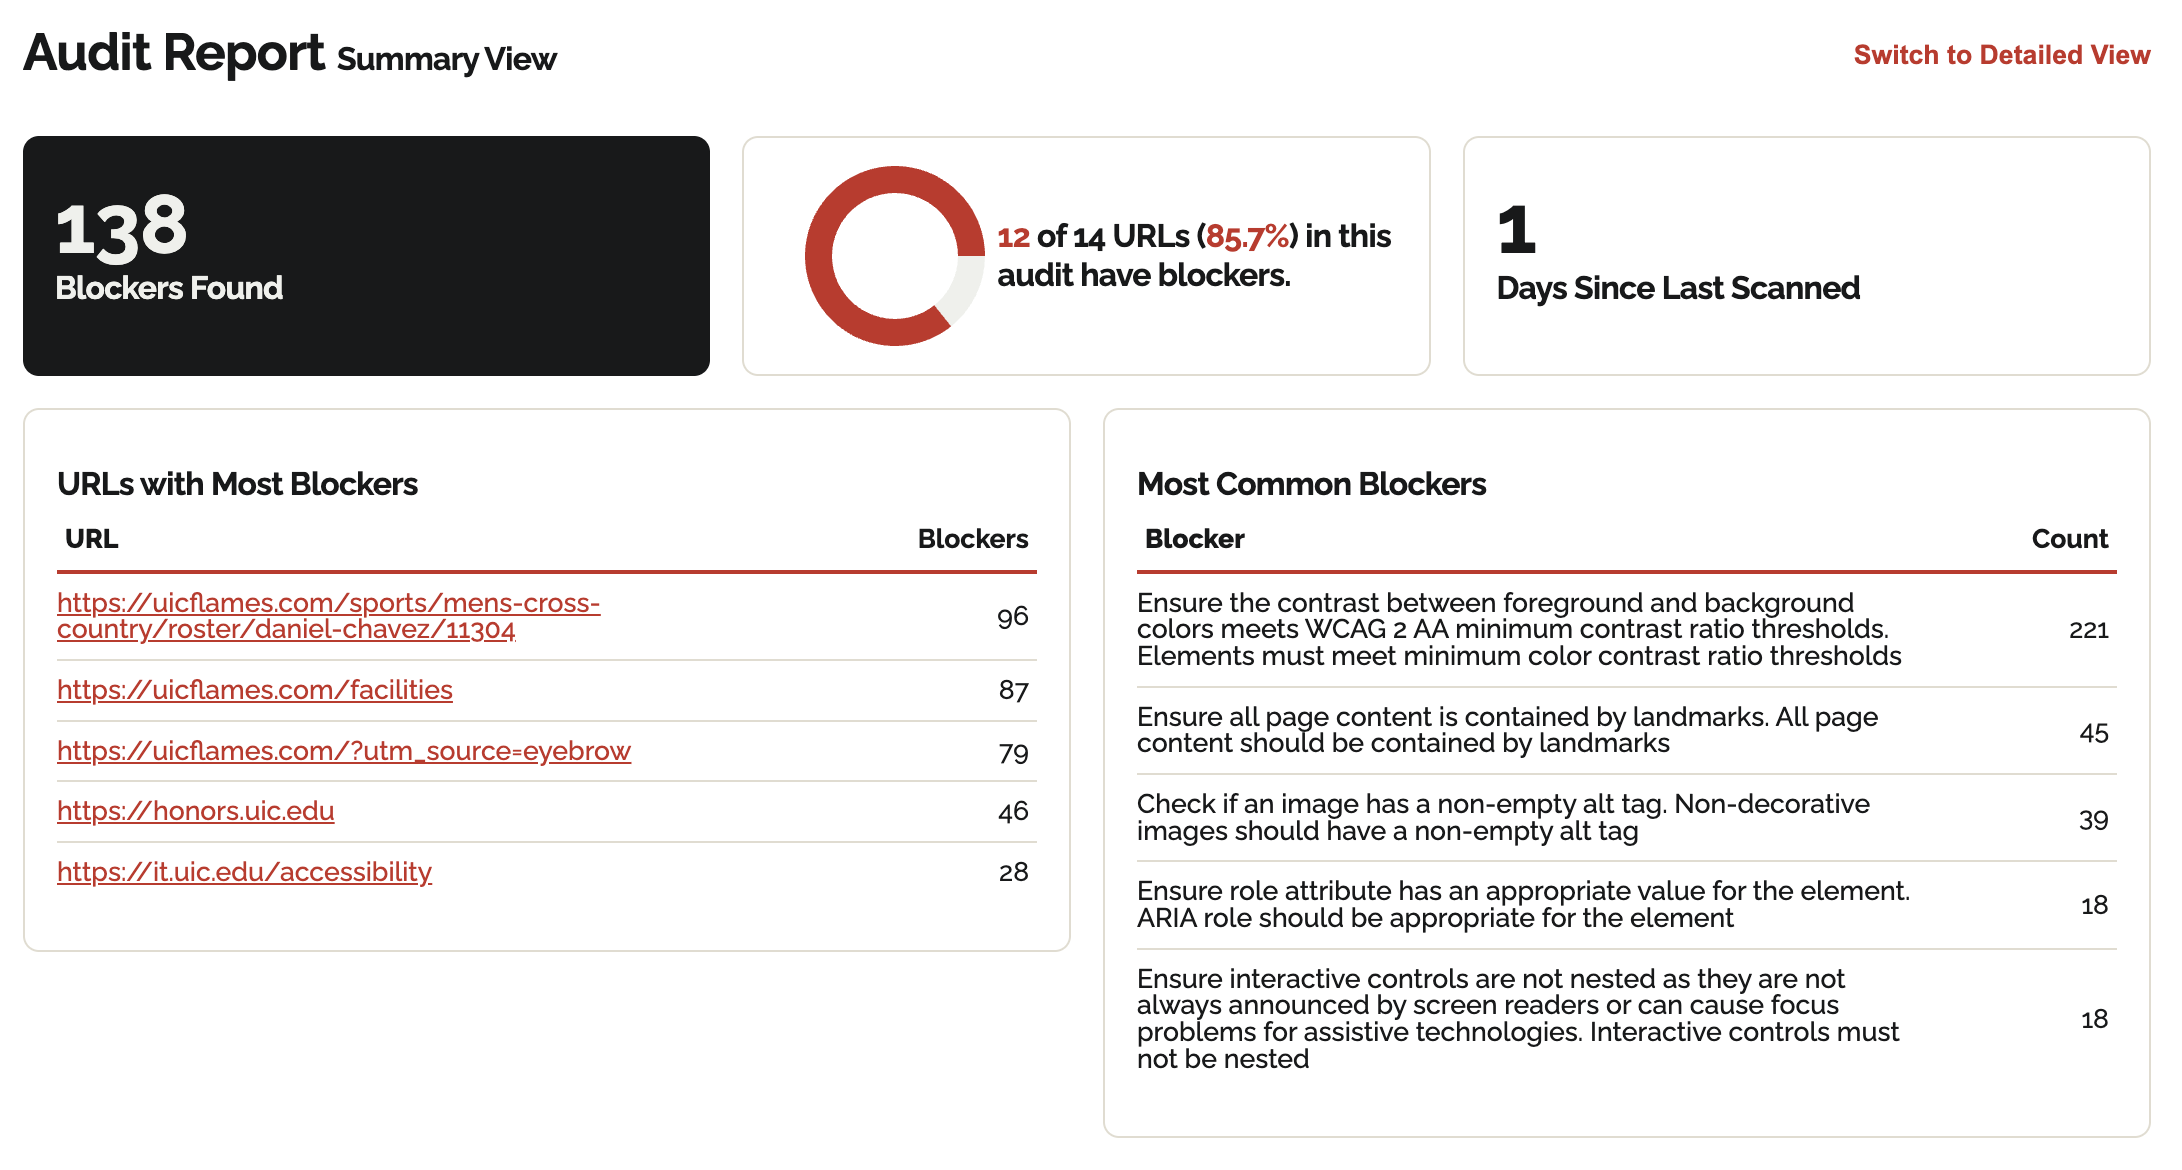
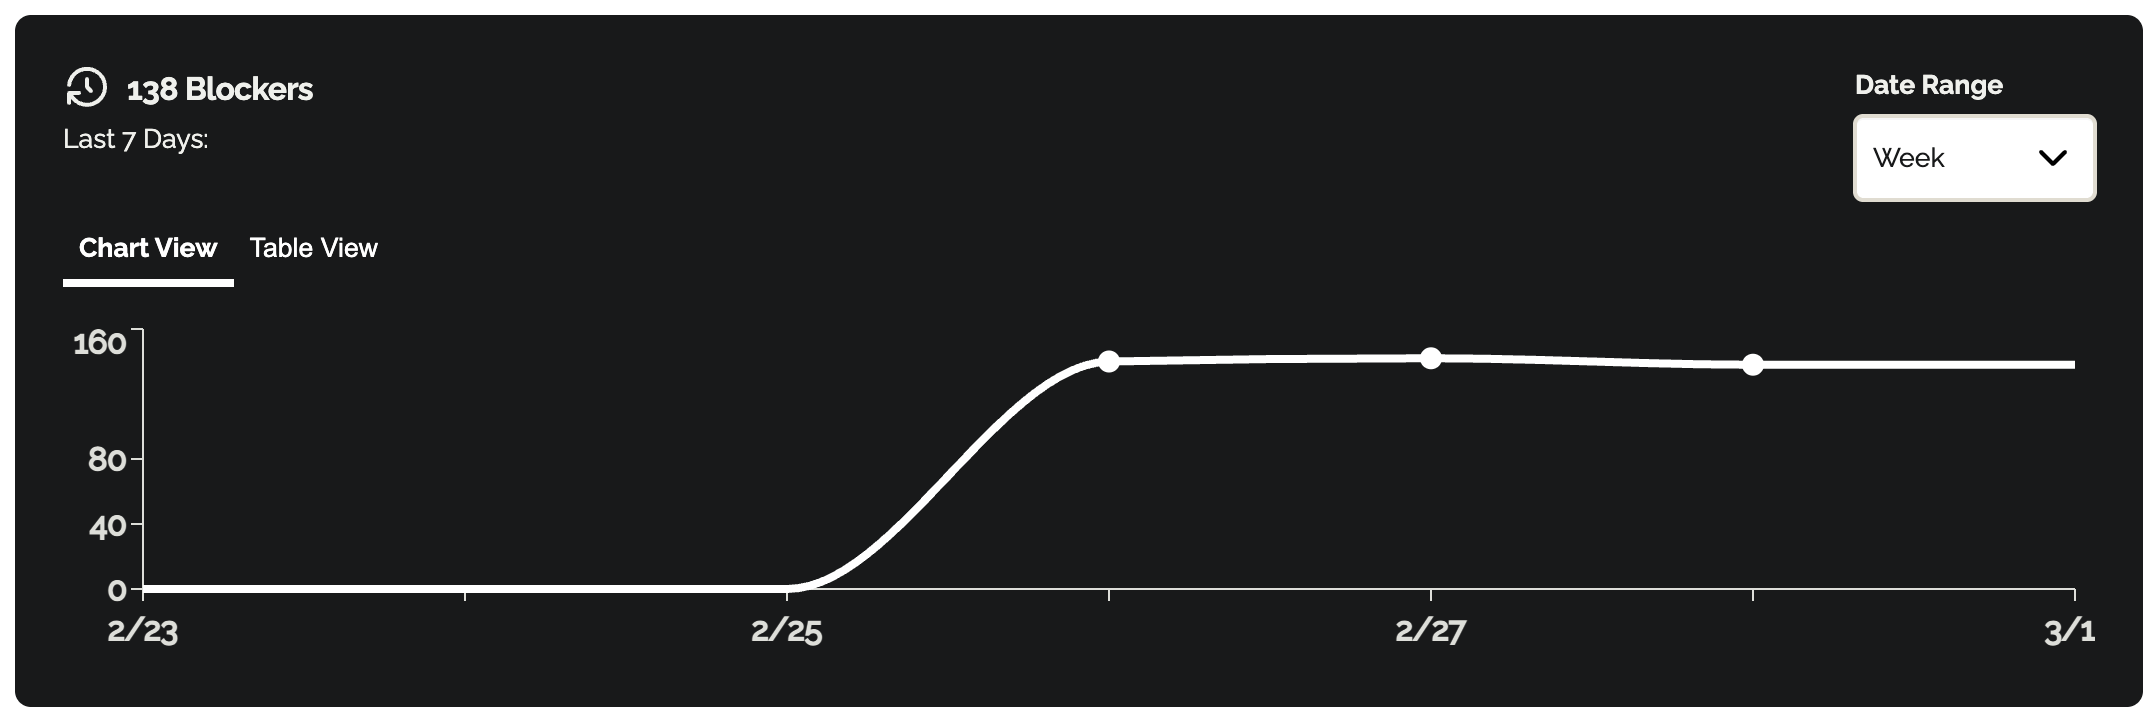
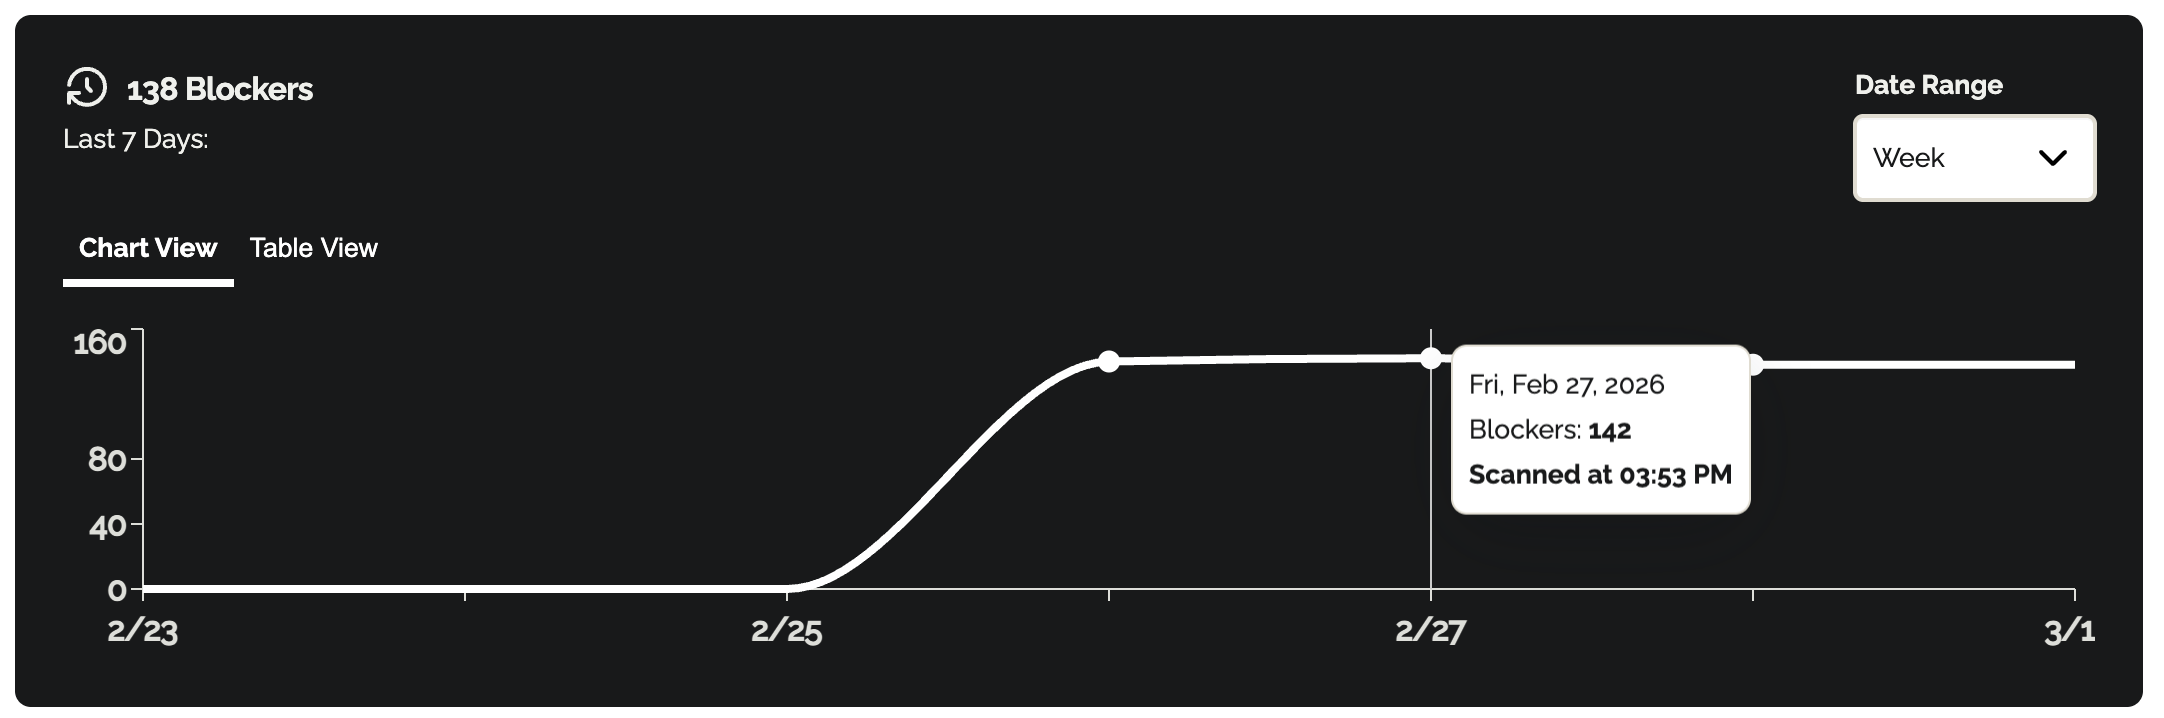
This section gives you an immediate look at the scale of accessibility issues.- Total Blockers: View the number of blockers the system detected across your monitored pages.
- Hover over the chart's datapoints to see details about each scan, including the scan date and the number of blockers.
- Toggle to Table View for an accessible way to review exact blocker counts by date.
Controls and Scheduling
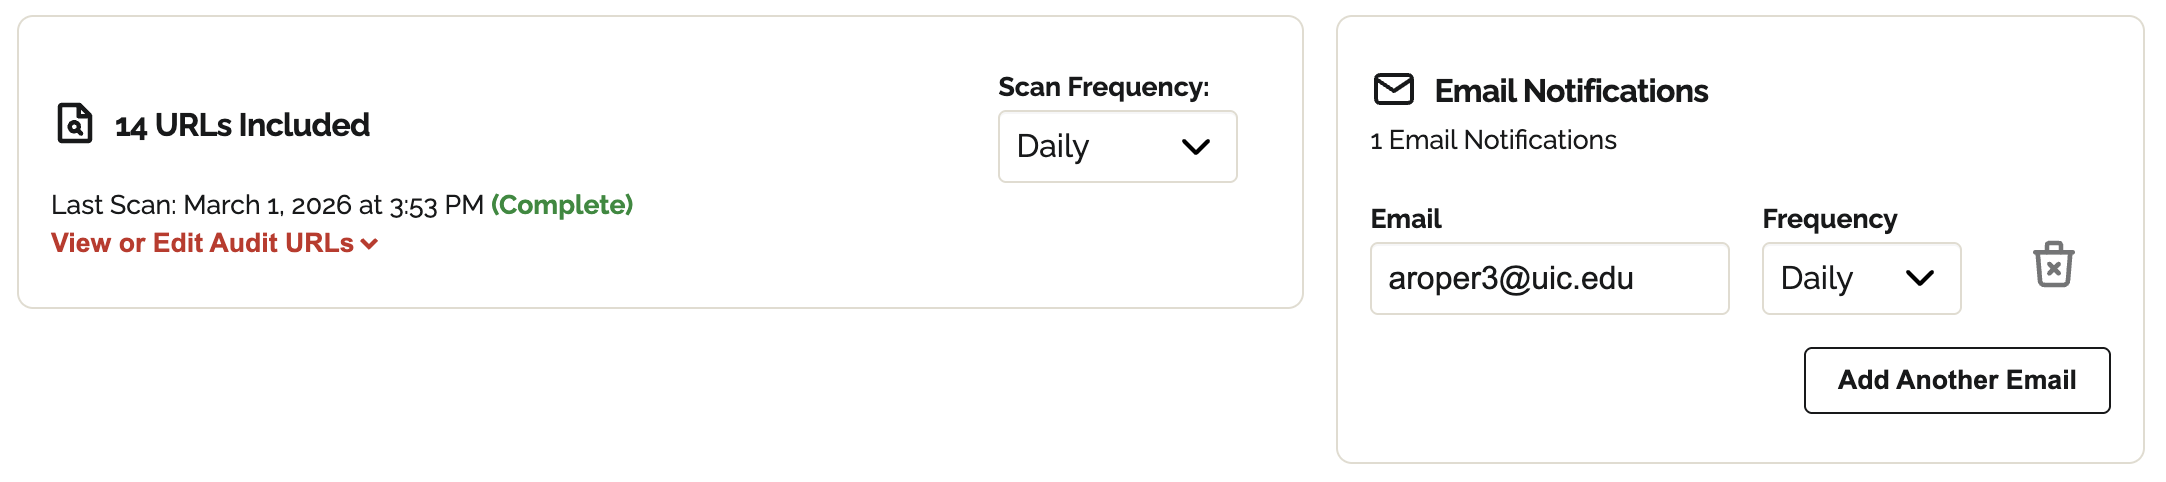
You can customize how often Equalify checks your site and who gets notified when results are ready.- Scan Frequency: Can be updated to Manual, Daily, Weekly, or Monthly.
- Notifications: This list shows all email addresses that receive the reports. You can add more workspace members using the "Add Another Email" button.
Critical Data Tables
The bottom of the dashboard breaks down the "where" and "what" of your accessibility gaps.- Scan Status: View the date of the last check and the total number of URLs scanned.
- Audit Health: Approximately what percent of the pages scanned contain blockers that need your attention?
- Days Since last scan: When the last scan occurred.
- URLs with Most Blockers: This table ranks your pages by the number of issues found.
- Most Common Blockers: This section identifies the specific types of errors found and their frequency.
- Detailed view: Toggle to the Detailed View to access the granular data behind the summary. We will cover the specifics of this view in the following page.